Daily Business Intelligence(ODBI)
Daily Business Intelligence is an out-of-the-box reporting and analysis framework that enables senior managers and executives to see relevant, accurate, and timely information using dashboards and drill-to reports.
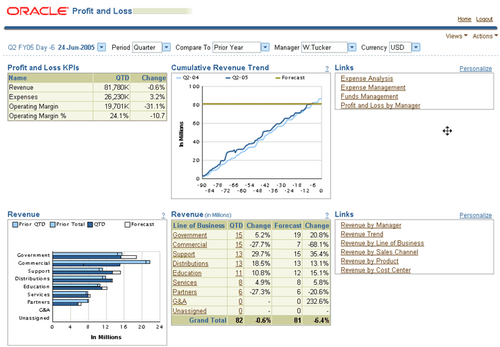
1. Each dashboard is designed for a particular management responsibility. Managers can drill from the summarized information on each dashboard to detailed reports or to specific transactions in underlying applications. For example, the Profit and Loss dashboard is designed for a profit center manager, such as a CEO. This dashboard summarizes profit and loss information such as revenue, expenses, and operating income. From this dashboard you can drill to the Revenue Summary report or down to specific transactions in Oracle Receivables.
2. Dashboards are also designed to be relevant for a particular user. When a user opens a dashboard, the information displayed changes depending on the user's Oracle Applications security privileges. That way, each manager only views information that is relevant to his or her management area. For example, if the CEO of Vision Corporation uses the Profit and Loss dashboard, he can view data for all companies, operating units, and people in Vision Corporation. However, if the Vice President of North American Accounting for Vision Corporation uses the Profit and Loss dashboard, she can only view data for the companies, operating units, and people that fall within her
management area.
3. Daily Business Intelligence's unique architecture simplifies the reporting process and ensures that managers are looking at the most accurate and up-to-date data. Because Daily Business Intelligence is part of Oracle E-Business Suite and runs in a single instance, reporting data does not need to be replicated from a transaction instance into a
reporting instance. Instead, changes are visible in dashboards as soon as you run the incremental request set for the dashboard. For example, if you book an invoice in Oracle Receivables, that invoice is reflected in the Profit and Loss dashboard the next time the incremental request set is run. You do not need to do any additional processing toupdate your data.
4. Daily Business Intelligence optimizes Oracle 9i R2 and later version's materialized views and incremental refresh capabilities. This summarizes data efficiently, and when you run the incremental request set, only the data that has changed is updated. Because Daily Business Intelligence enables you to summarize data daily, managers can
perform true day-to-day comparisons. For example, managers can compare results for December 12, 2003 against results for December 12, 2002.
To use Daily Business Intelligence effectively, you should familiarize yourself with the following terms:
Responsibility: A responsibility is designed for a particular business function or user such as a Cost Center Manager. Responsibilities are preseeded by an intelligence area and provide access to a particular dashboard or set of dashboards.
Each responsibility is preseeded and provides access to a particular dashboard or set of dashboards. For example, the Cost Center Manager responsibility enables access to the Expense Management dashboard. You cannot modify the preseeded responsibilities.
Each Oracle Applications user can be assigned one or more of the responsibilities and several users can share the same responsibility. The system administrator is responsible for assigning the appropriate responsibilities to each user.
Dashboard: A dashboard is a collection of content that is designed to meet the needs of a particular responsibility. Dashboards contain regions like parameters, tables, graphs, links, and Key Performance Indicators (KPIs).
In Daily Business Intelligence, a dashboard is designed to meet the needs of a particular management responsibility. For example, the Expense Management dashboard is designed for managers who manage expenses within their supervisor hierarchy. To access a dashboard, the system administrator must assign the appropriate responsibility to your Oracle Applications user ID. Your Oracle Applications security settings determine the data that you can see on each dashboard. For example, a manager can only view expenses for their subordinates and for the cost centers they are responsible for.
While the content of each dashboard is unique, the basic features and functionality of each dashboard is the same. All dashboards contain the following features:
Parameters
Regions
Links to Reports
All dashboards display the same basic functionality: ability to drill to transactional data, ability to drill and pivot on dimension values, ability to print, email, and start a web conference from a dashboard,
Region:
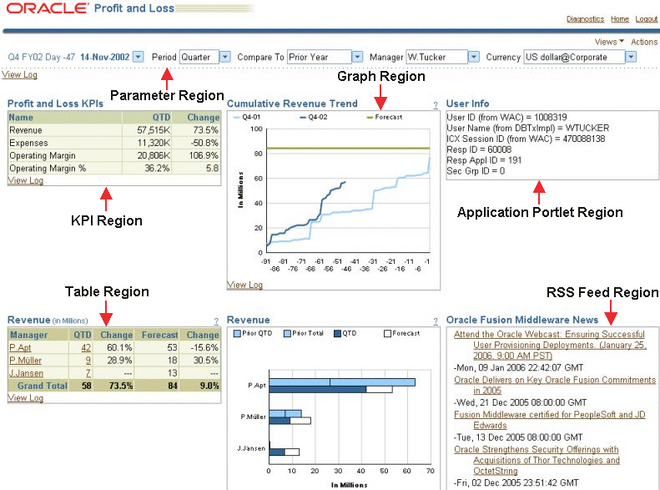
A region is a unique set of information on a dashboard. There are types of regions: parameter, KPI, table, graph, links,My Approvals, custom scorecard, RSS feed and simulation view. You can drill down to more detailed reports or to transaction details in Oracle Applications from all regions with the exception of the parameter region.
Parameter:
![]()
Every dashboard or report has a set of parameters that determine the data that is displayed.
The set of common parameters are, in order, from left to right:
- Date Parameter
- Period Parameter
- Compare To Parameter
- Primary Dimension Parameter
- Currency Parameter
Note: Some dashboards and reports do not display all of these parameters. The Primary Dimension parameter is different in each dashboard.
The default value for each parameter is either defaulted by the dashboard or defined when you set up Daily Business Intelligence. In some cases, parameters are display only and cannot be modified.
Every time you change the value of a parameter on a dashboard, the data on the dashboard is automatically refreshed. Changing a parameter can affect the amount of data, the column headings, the KPI values, and the graph formats.
KPI:
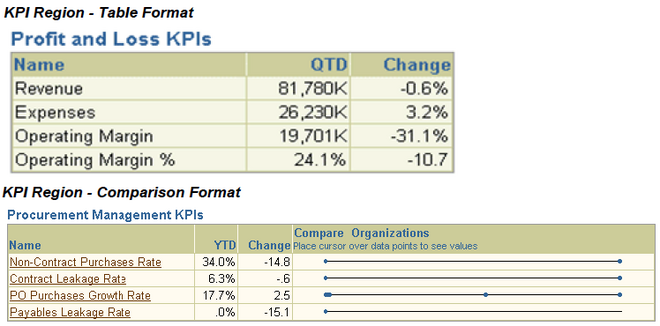
The KPI region displays the actual and change values as a percentage for every KPI on the dashboard. The actual and change or variance values are always calculated based on the value in the primary dimension parameter. For example, if the primary dimension is Manager, then the actual and change or variance values are calculated for
the manager selected.
The KPI region can be in either table or comparison format.
Reports:
Every table and graph region (and most KPIs) on a dashboard are based on a report. You can drill from regions or KPIs to the underlying reports by clicking on the linked values and text in the regions. For example, you can click on the region title to view a summary report, or click on a value in a table region to view a detailed report.
Reports are similar to dashboards and regions, but have the following differences:
• Reports enable you to drill and pivot on values in the first column of the report table.
Drill and pivot functionality enables you to view the value by any other dimension, except for time.
• Reports can display more rows and columns of data.
• Reports do not truncate data.
• Report table columns can be sorted.
• Report data can be exported to a Microsoft Excel spreadsheet.
Refresh Data
Only the Daily Business Intelligence administrator can refresh the underlying data set for dashboards and reports (for example, update the employee headcount, revenue, or items shipped numbers). The administrator must run the incremental request set for each dashboard to refresh the data. The incremental request set automatically updates any data that has changed since the initial request set or since the data last updated date. Your Daily Business Intelligence administrator schedules the incremental request sets daily or at another regular interval. If you suspect that your data is out of date, then contact your system administrator